Setup freqtrade with grafana


- docker - Basic requires for understand what is docker/docker-compose.
I spent ~2 week for setup freqtrade and dependencies on my personal raspberry PI4.
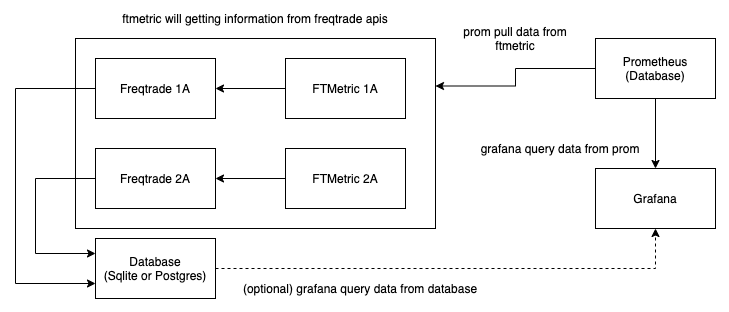
Above image is the simplified version. How it works is Prometheus will call ftmetric to information and save to internal database. Grafana will fetch data from Prometheus via PromQL and show it as beautiful graph.
I'm using docker-compose as it support run multiple docker containers in single file and very easy to setup.
First you need docker-compose.yml file (more detail here). This file will contain all component (docker container) you need to run full-stack freqtrade-grafana. If you not familar with yml syntax, you might take a look on Wiki. If you don't know how to start, I provided simple docker-compose.yml
Important config in docker-compose file.
- version - This should place on first line in the file (I recommend to use version
3)
version: "3"
- services - This will contains each of docker container
services:
  <service_name>:
    image: <image_name>:<image_tag>
Next, on each service you can setup parameters, environment or command to execute, here is impartant config you might need. Below configuration must place in <service_name> in docker-compose.yml
I recommend to use static version to avoid break change. Static version is version with following format
vX.X.XwhereXis number
- image - image name and version to use
- restart - what do you need when container is down
- ports - expose port from docker container to local machine. This will make you able to call application from local machine
- volumes - Normally after docker is stopped, all data in that container will be deleted as well. You can map data from directory/files to either local machine or docker internal volume, and data will stand forever (until you manually delete it)
- depends_on - To start current container after depends_on list. Warning: This NOT wait application to fully started, it only wait docker to start
- environment - Additional environment variable in containers
- healthcheck - Help docker understand when ever application is down or crash
- user - Override user (uid) in docker container by add
user: "1000"in docker-compose file (not recommend) - extra_hosts - You can add
"host.docker.internal:host-gateway"for calling local machine inside docker network
After you have file. You can run follow command in same directory of docker-compose.yml
# create and start and monitor docker-compose logs
docker-compose up
# create start docker-compose in background
docker-compose up -d
# only stop docker containers
docker-compose stop
# stop and delete all data relate to this docker-compose
docker-compose down
This is my simplied docker-compose.yml
Docker: https://github.com/kamontat/fthelper/pkgs/container/ftmetric
I did open ftmetric source on Github today. On repository will decribe more how to configure and use this.
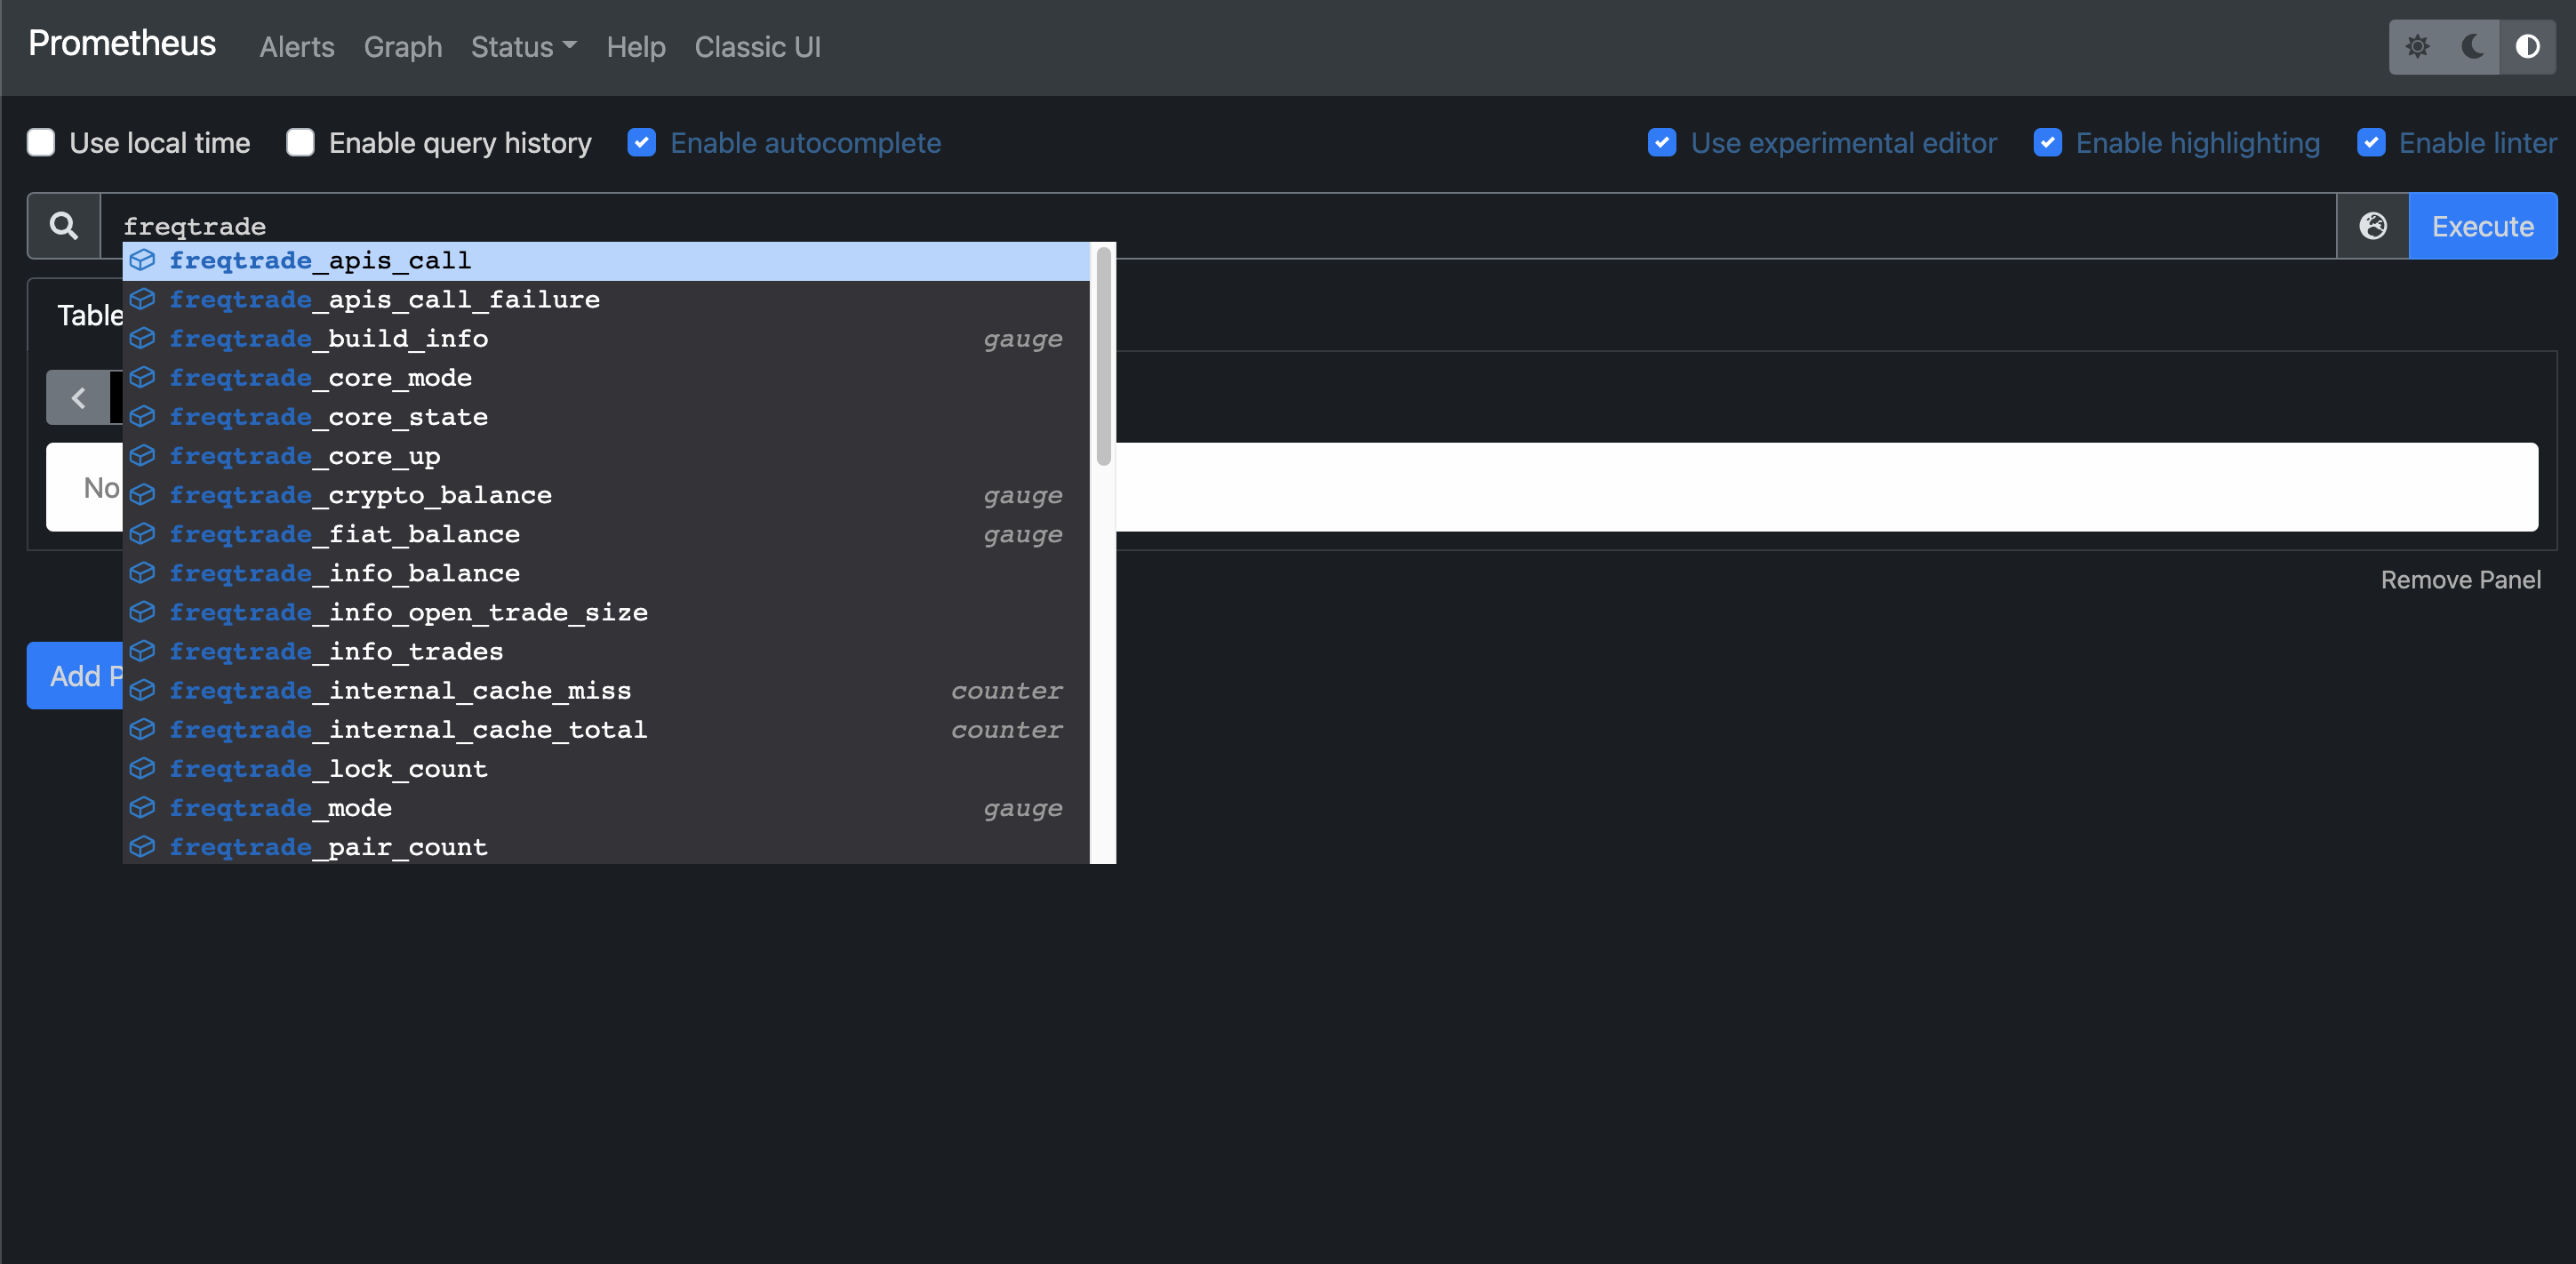
For short descibe. Ftmetric is prometheus exporter. It will call freqtrade rest apis to get information and show as formatted syntax when someone call /metrics endpoint.
This should use for POC only, NOT recommend for production
# show help
docker run --rm -it ghcr.io/kamontat/ftmetric --help
# show all config listed on this script
docker run --rm -it ghcr.io/kamontat/ftmetric --list-config
# quick run
docker run --rm -it -p 8090:8090 ghcr.io/kamontat/ftmetric \
  freqtrade.url=http://localhost:8080 \
  freqtrade.username=freqtrader \
  freqtrade.password=verysecretpassword
Prometheus is time-series database. It need target (ftmetric) to pull data from. To config prometheus, you need prometheus config which will configure prometheus settings.
More detailed: https://prometheus.io/docs/prometheus/latest/configuration/configuration/
global:
  scrape_interval: 1m
  scrape_timeout: 5s
scrape_configs:
  - job_name: freqtrade
    static_configs:
      - targets:
        - "ftmetric:8090"
- scrape_interval - how many time prometheus wait before pulling new data
- scrape_timeout - if target response time above timeout, it will force fail and try again new pulling
- scrape_configs - contains targets to pull
- job_name - name show in prometheus metric label
- targets - pulling url, you can use
<service_name>in docker-compose file as hostname if pulling from other docker container ORhost.docker.internalif call it local machine (require setupextra_hostsin docker)
Check latest version first
The extra_host will allow you to call server on your server (not in docker) by replacing localhost with host.docker.internal. This might be handy if you run your bot outside docker.
prometheus:
  image: prom/prometheus:v2.28.0
  restart: on-failure
  # be aware that prometheus DOES NOT have builtin authentication
  # ports:
  #   - 9090:9090
  volumes:
    # you can config prometheus via this directory (prometheus.yml)
    - ./prometheus/config:/etc/prometheus/
  command:
    - "--config.file=/etc/prometheus/prometheus.yml"
  extra_hosts:
    - "host.docker.internal:host-gateway"
If you found following logs, It might because you didn't has permission. You can either add permission to directory that you map from (recommend) or override uesr id in docker-compose
level=error ts=2021-07-06T10:44:08.309Z caller=query_logger.go:109 component=activeQueryTracker msg="Failed to create directory for logging active queries"
level=error ts=2021-07-06T10:44:08.309Z caller=query_logger.go:87 component=activeQueryTracker msg="Error opening query log file" file=data/queries.active err="open data/queries.active: no such file or directory"
panic: Unable to create mmap-ed active query log
Grafana is data visualization. Basically It can be replace freqUI. What Grafana do is query data from datasource and show them as beautiful graph. Default port of grafana is 3000
I already cover how to start/run grafana in docker-compose section. So I assume that you should able to open grafana at <host>:3000. Below is steps you need to setup grafana before it can query data
- Add datasource via Configuration
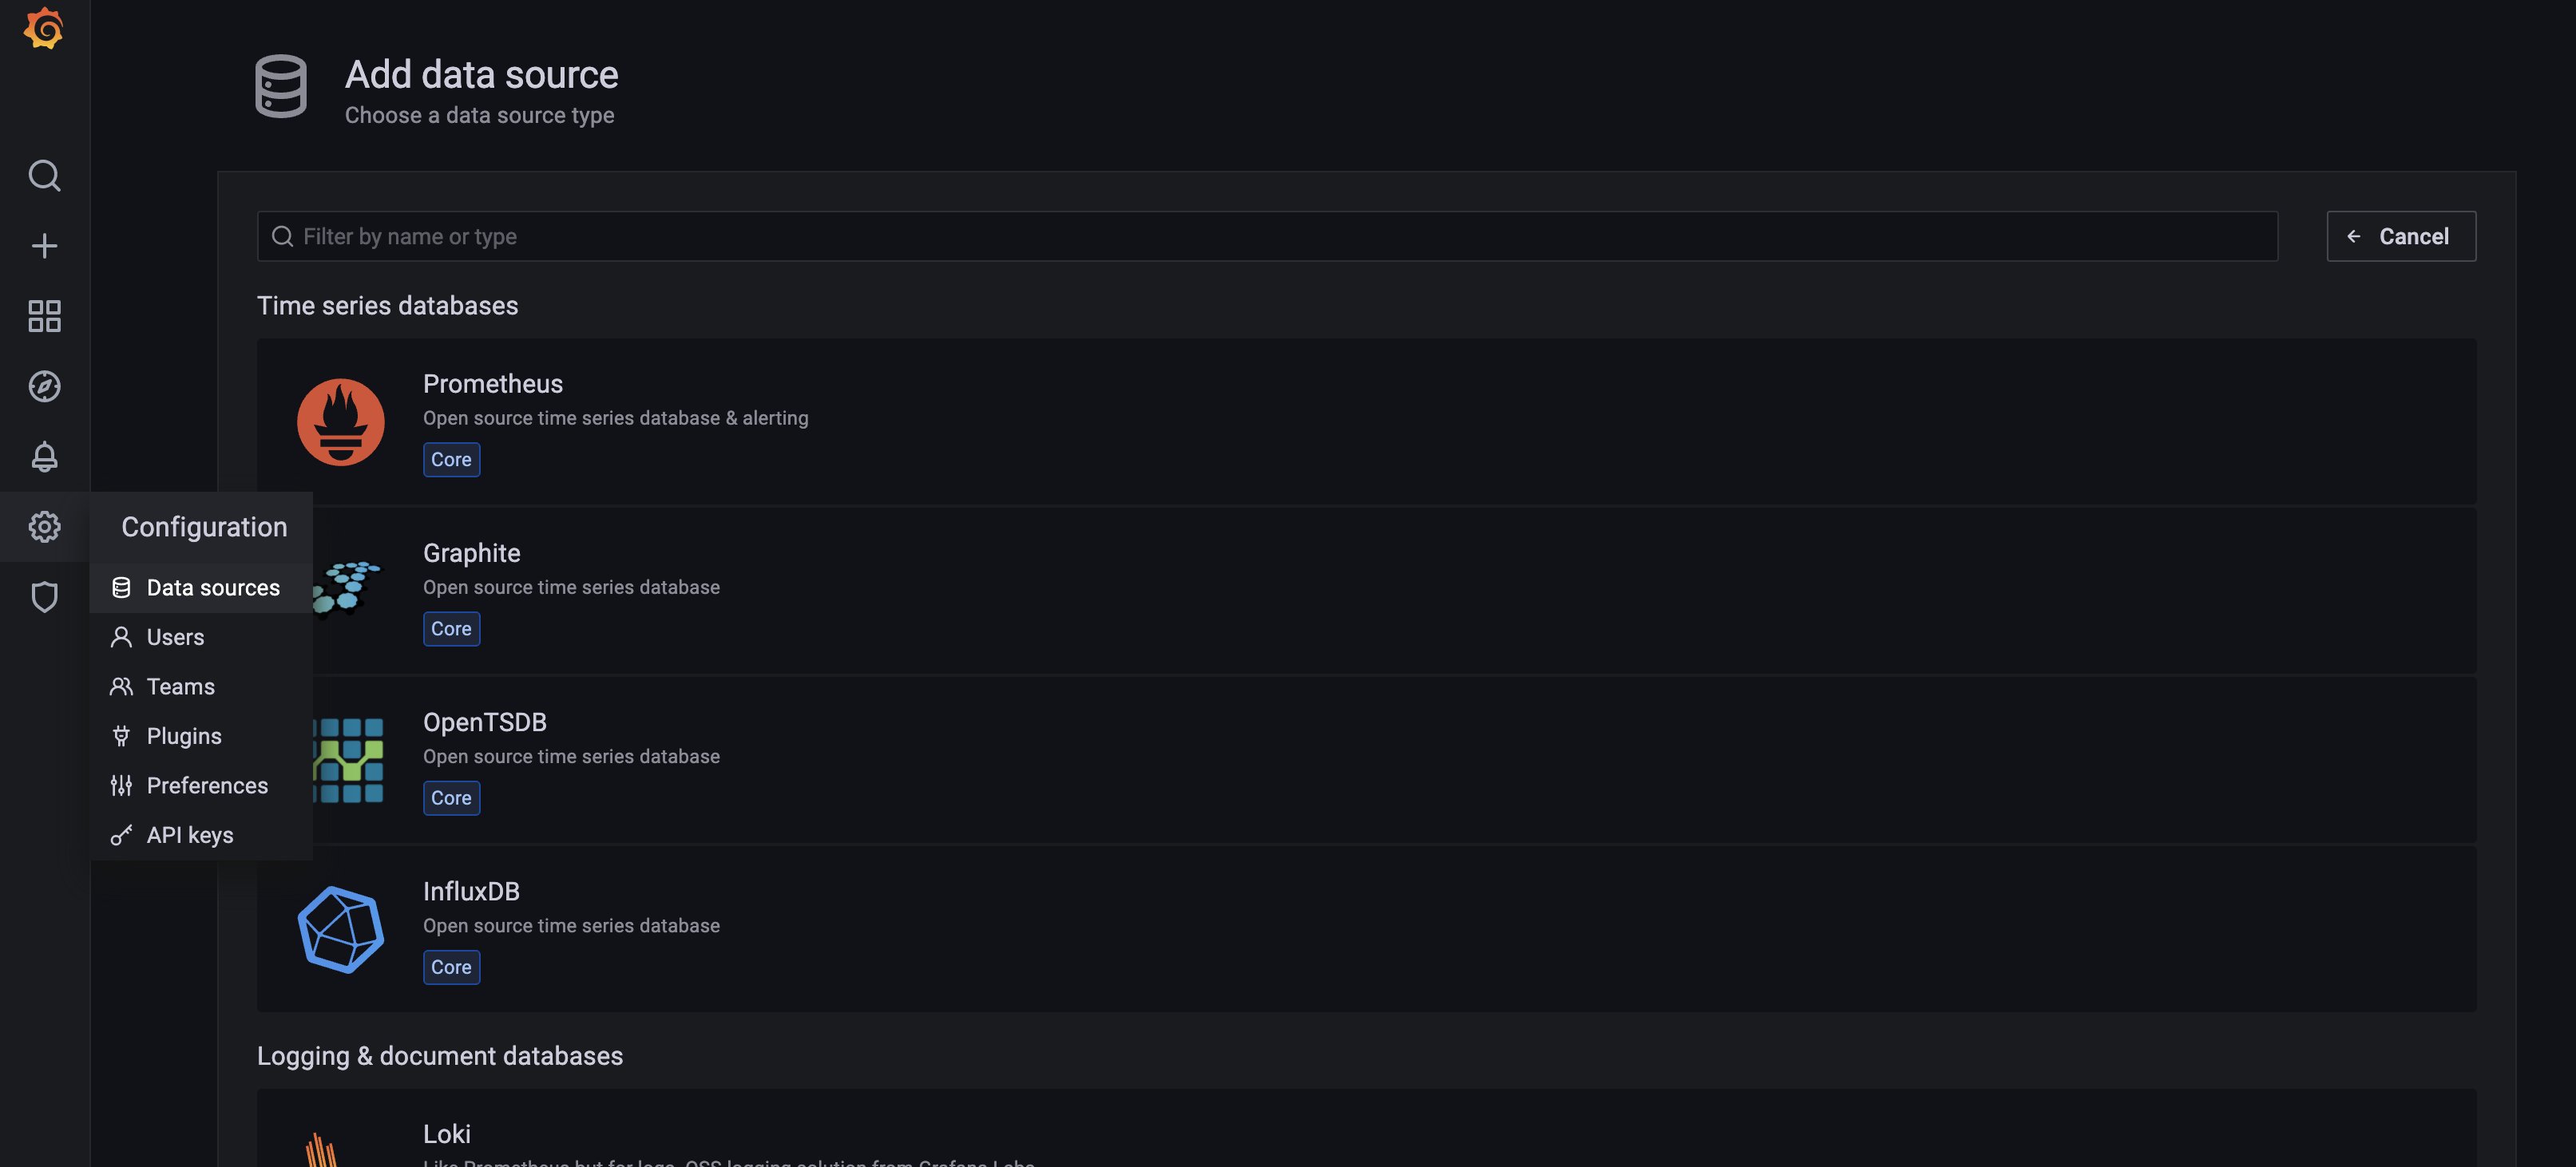
- Add
Prometheusdatasource with following config- url -
prometheus:9090or name of docker-compose<service_name>
- url -
- (optional) Additional of prometheus, you can add database as well (either
postgresorsqlite) - (optional) Import predefined dashboard at 14632